Top Exploratory Data Analysis (EDA) Tool Comparison
An in-depth comparison of top 5 Exploratory Data Analysis (EDA) software tools to find the right one for your next data science project.
6 min read

We are looking at these 5 different EDA tools:
Intro
Data cleaning isn't the biggest challenge for Data Scientists and ML Engineers, but it does take the longest amount of time. For most of us we can't even know how to clean it until we explore the data and thats where Exploratory Data Analysis (EDA) tools come in very handy.
Pandas-Profiling
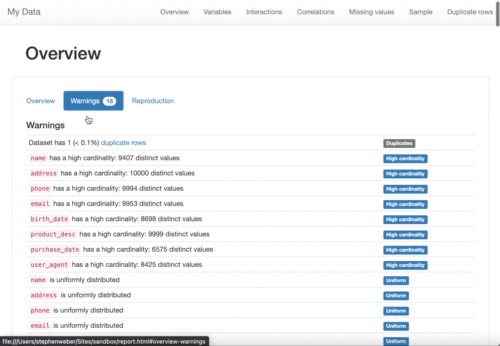
Pandas Profiling is a robust Python EDA library and Command Line utility that generates an interactive HTML report of your data. It supports Notebooks and generic python scripts as well. To have it generate a report is about 2 lines of code and has a lot of customizations. What Pandas Profiling offers above some others is large and sensitive dataset handling.
Features
- Overview of data
- Automatically detects data types
- Data Distribution
- Descriptive statistics
- Quantile statistics
- Missing values charts
- Correlations
- Text analysis
Unique Features
- Robust correlation visualizations
- Handles sensitive datasets
- Very fast even on large datasets
Installation
pip install pandas-profiling[notebook]
Usage
import pandas_profiling

# Create instance of pandas-profiling
profile = pandas_profiling.ProfileReport(df, title = 'My Data', explorative = True)

# Generate HTML Report
profile.to_file('report.html')
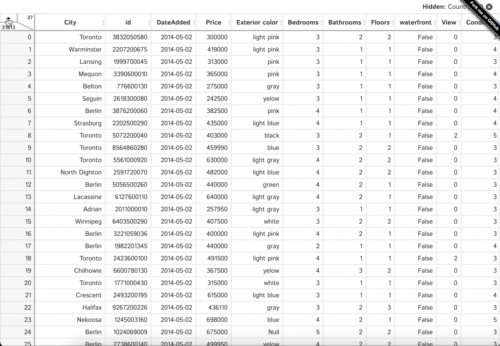
BitRook
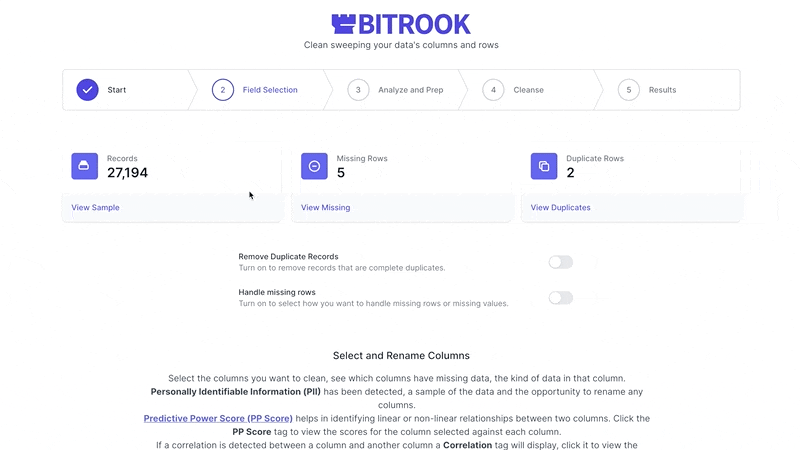
BitRook is a modern take on the challenge of EDA. It packages a lot of the best parts of the other tools and puts it together in a desktop app that doesn't require coding experience. After finished with your EDA work, you can even clean and standardize it.
Features
- Overview of data
- Automatically detects data types
- Data Distribution
- Descriptive statistics
- Quantile statistics
- Missing values charts
- Correlations
- Generates python code
Unique Features
- No code EDA
- Low-code data cleaning
- Uses AI to help you clean the data
- Identifies PII data
- Automatically calculates Predictive Power Score
Installation
It's a simple downloadable desktop app
Usage
Great video tutorials and support
Sweetviz
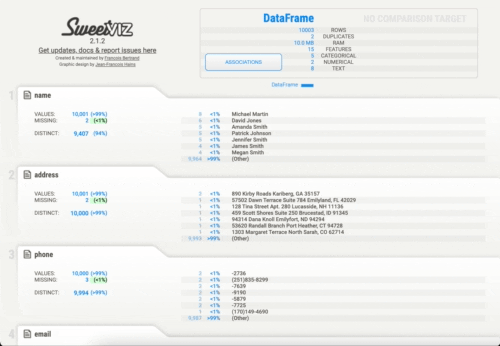
Sweetviz is a Python library that generates EDA visualizations in a fully self-contained HTML application. It has all the common data points like missing, distinct, duplicates but Sweetviz also can compare training data vs test data and shows how a target value relates to other features. Its really simple to use and in the couple of use cases its usually just 2 lines of code, so the docs are a little light due to that.
Features
- Overview of data
- Descriptive statistics
- Automatically detects data types
- Missing values charts
- Correlations
- Visual Comparisons (training vs test data)
- Target analysis
Unique Features
- Comparing 2 datasets together (training vs test data)
- Target analysis
Installation
pip install sweetviz
Usage
import sweetviz

report = sweetviz.analyze(df)

report.show_html('report.html')
Autoviz
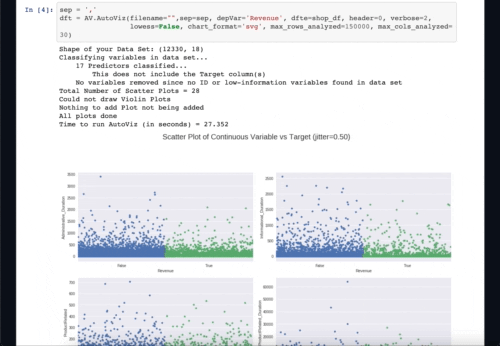
Autoviz is usually thrown out there as a EDA suggestion and while Autoviz is an amazing tool I think it is a much more specific tool. Autoviz is geared towards target analysis and it takes a sophisticated approach to it. AutoViz can find the most important features and plot impactful visualizations only using those automatically selected features. An XGBoost model is repeatedly used to randomly check each feature to find the most prominent selected features. AutoViz will take a random sample if the dataset is too large. If you use Anaconda, Jupyter and are looking to find the most important features then Autoviz might be the option for you.
Features
- Interactions and Correlation
Unique Features
- Target analysis
- Finds prominent features
- Requires anaconda and a Jupyter notebook
Installation
conda create -n <your_env_name> python=3.7 anaconda
conda activate <your_env_name> # ON WINDOWS: `source activate <your_env_name>`
pip install autoviz
Usage
from autoviz.AutoViz_Class import AutoViz_Class
AV = AutoViz_Class()
df = AV.AutoViz('report.csv')
D-Tale
D-Tale is a horse of a different color. It does an incredible amount of things that are hard to properly list. Technically it is a Flask web server backend app with a React frontend that allows you to actively explore the data. Its incredibly easy to get started with (2 lines of code) and supports ipython notebooks & python/ipython terminals as well. The only thing about this tool is that it takes some time to learn where everything is, lots of exploration but is incredibly powerful (and fairly fast).
Features
- Overview of data
- Automatically detects data types
- Data Distribution
- Descriptive statistics
- Quantile statistics
- Missing values charts
- Correlations
- Text analysis
- Custom graphs
Unique Features
- Predictive Power Score
- Code export on most visualizations you see
- Dark mode (its important for some people)
Installation
pip install dtale
Usage
import dtale

# Run d-tale library on dataframe
d = dtale.show(df)

# Opens your server's default browser to this process
d.open_browser()
Pandas GUI
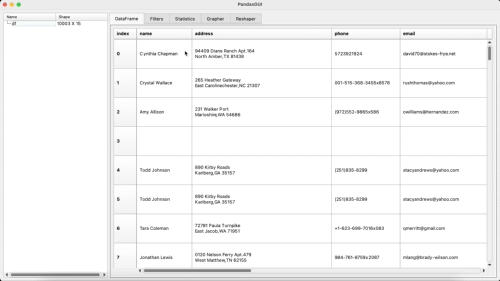
Pandas GUI is the new kid on the block and it has some surprises under the hood. Instead of focusing on data quality (missing data and duplicates), it focuses on making it easy to reshape the data and allow you to generate your own charts with a simple drag and drop. If you find it cumbersome to make your own charts than this is an easy way to do it.
Features
- Automatically detects data types
- Descriptive statistics (partial)
- Missing values charts
- Correlations
- Text analysis
- Custom graphs
Unique Features
- GUI application
- Query filtering for exploration
- Pivot and melt features for reshaping data
Installation
pip install pandasgui
Usage
from pandasgui import show

show(df)
Summary
There are a lot of ways someone could compare EDA tools with each other, but I am going to take a very basic approach by looking at 6 main categories: Data Quality Check, Statistical Data, Quantitative Data, Visualizations and Target Analysis.
| EDA Tool | Downloads | Data Quality | Statistical | Quantitative | Visualization |
|---|---|---|---|---|---|
| Pandas-Profiling | ✅ | ✅ | ✅ | ✅ | |
| BitRook | ✅ | ✅ | ✅ | ✅ | |
| Sweetviz | ✅ | ✅ | ✅ | ✅ | |
| Autoviz | ➖ | ➖ | ➖ | ✅ | |
| D-Tale | ✅ | ✅ | ✅ | ✅ | |
| Pandas GUI | ➖ | ✅ | ➖ | ✅ |
Clean Data 10x faster using AI with BitRook.
Download the app here for FREE.
We won't send you spam. Unsubscribe at any time.